YOKOGAWA AQ23011A/AQ23012A Modular
Product positioning and core applications
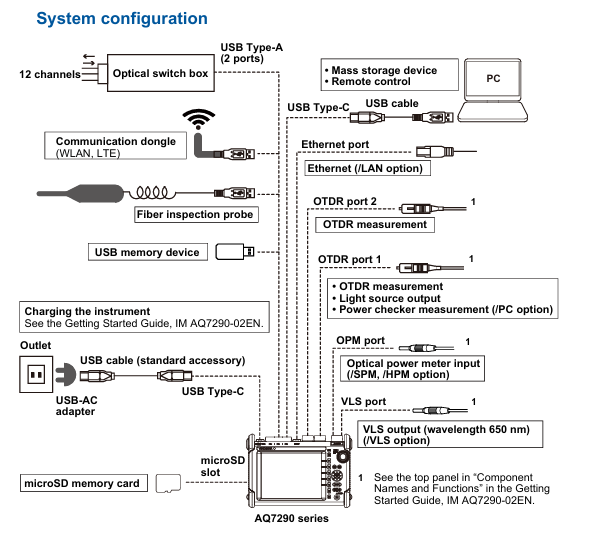
AQ23011A/AQ23012A is a modular framework device that requires the use of AQ23811A and other source measurement modules (SMUs). Its core function is to achieve high-precision output (source function) and measurement (measurement function) of voltage/current, supporting multi-channel synchronous control and complex scanning analysis. The main application scenarios include:
Semiconductor testing: testing of chip pin voltage/current characteristics, measurement of MOSFET threshold voltage.
Electronic component verification: impedance characteristic analysis of resistors/capacitors/inductors, and forward voltage drop testing of diodes.
Calibration of new energy devices: collection of lithium battery charge and discharge curves, scanning of photovoltaic module IV characteristics.
Core technical parameters and hardware structure
1. Key technical parameters
Taking the core module AQ23811A (2-channel SMU) as an example, the core parameters are as follows:
Parameter category specific specifications
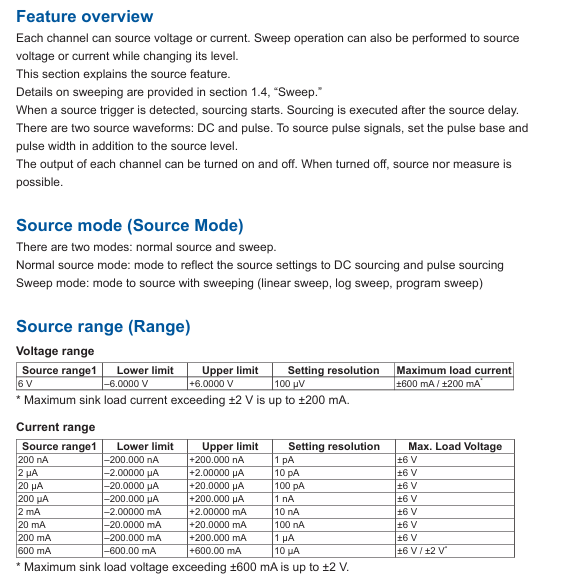
Source output range voltage: ± 6.0000 V (resolution 100 μ V, maximum load current ± 600 mA/± 200 mA, drops to ± 200 mA when exceeding ± 2 V)
Current: 200 nA~600 mA, with a total of 8 ranges (such as a resolution of 1 pA for the 200 nA range, a resolution of 10 μ A for the 600 mA range, a maximum load voltage of ± 6 V/± 2 V, and a decrease to ± 2 V when exceeding ± 600 mA)
Measurement accuracy voltage measurement: ± 0.01% reading ± 0.01% range (23 ℃± 5 ℃, 6 V range)
Current measurement: ± 0.02% reading ± 0.02% range (23 ℃± 5 ℃, 200 mA range)
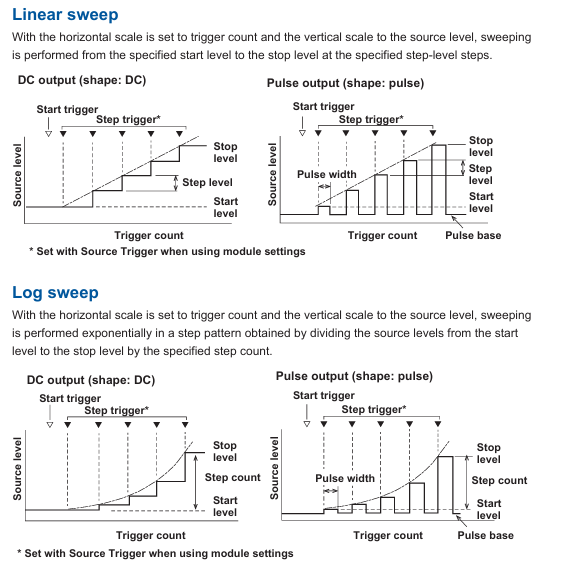
Scanning Function Scanning Types: Linear Scan, Logarithmic Scan, Program Scan (CSV Format Custom, Maximum 100001 Steps)
Repetition frequency: 1-1000 times or infinite loop
Trigger system trigger source: Bus trigger (BUS Trigger1-9), front panel trigger, internal timer (1 μ s~1s adjustable), source signal change (Src Change)
Trigger delay: 1 μ s~1 s (resolution 1 μ s)
Interface and storage interface: Ethernet (1000BASE-T), USB 3.0 (2 host ports+1 device port), GP-IB (optional)
Storage: Internal storage (219 GB for each dual zone), USB external storage, supporting BIN/CSV/PNG formats
2. Hardware structure and component functions
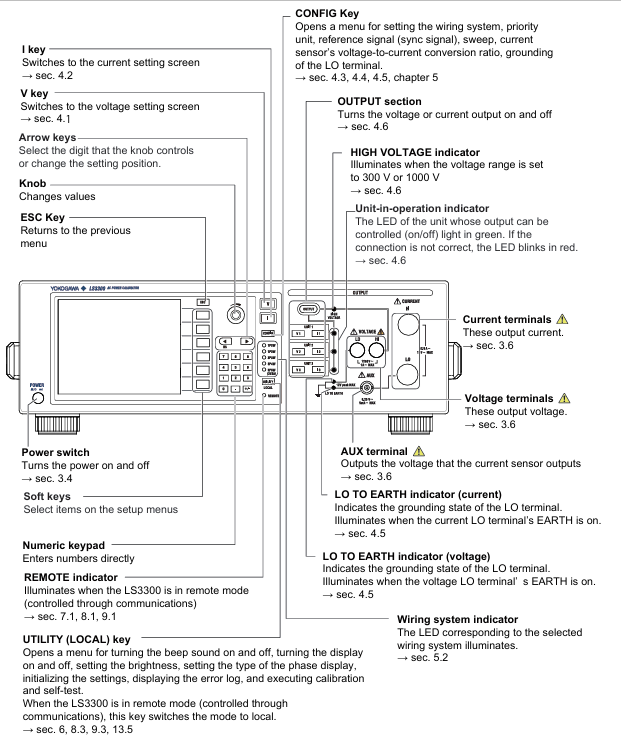
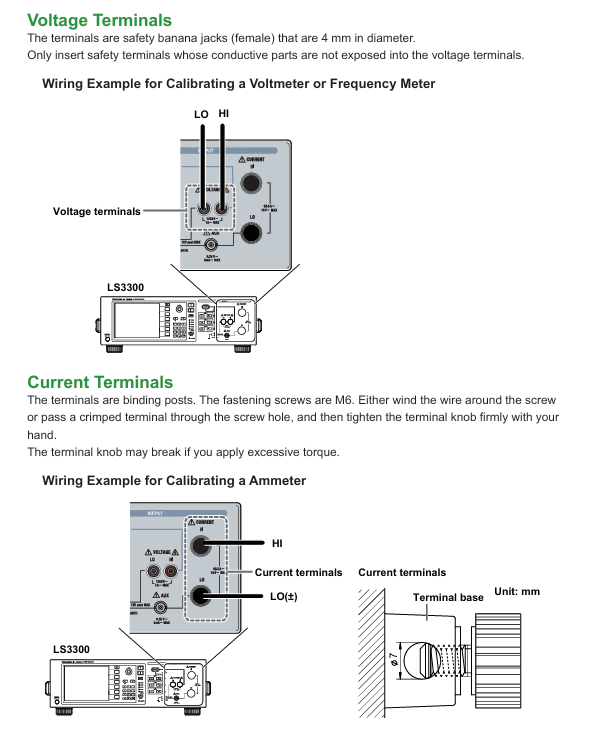
(1) Core components of the front panel
Component name, location, and function
There are 9 slots on the left side of the module slot (AQ23011A/AQ23012A universal), used for installing modules such as AQ23811A, slot numbers 1-9
10.1-inch color LCD (1280 × 800 pixels) in the center of the touch screen display, supporting touch operation (menu navigation, parameter settings)
The F1~F6 keys at the bottom of the function soft key screen correspond to menu options and dynamically change with the interface
Each module on the front panel corresponds to one trigger input/output terminal (TTL level, negative logic) for external trigger signal interaction
There are two USB 3.0 ports on the right side of the USB host interface, which can be inserted into a USB flash drive/portable hard drive to save data, or connected to a mouse/keyboard
Power button on the right side of the power and status light (with LED indicator light, green constant light for normal), error indicator light (red flashing for fault)
(2) Core components of the rear panel
Component Name Function
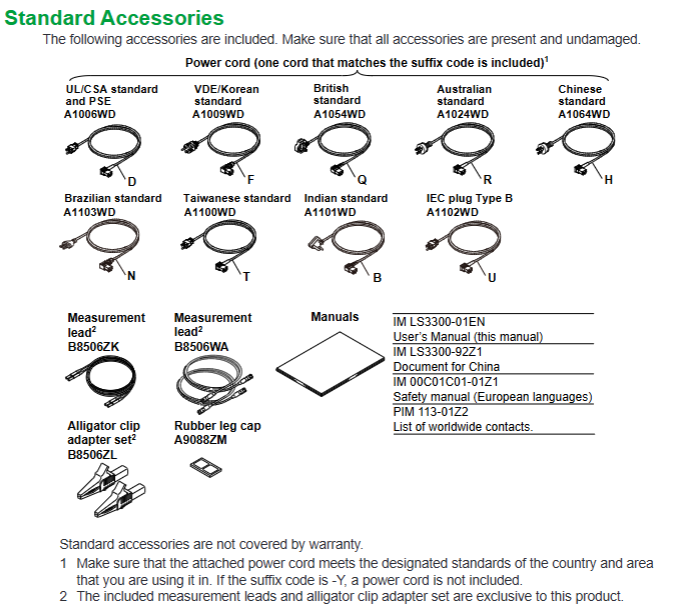
AC power interface connected to dedicated power cord (input 100~240 VAC, 50/60 Hz, maximum power consumption 120 VA)
Ethernet interface RJ45 interface, supporting TCP/IP protocol, used for remote control (HiSLIP/RawSocket) or network file sharing
External trigger interfaces Trig IN1/Trig IN2 (BNC interface, TTL level), Trig OUT1/Trig OUT2 (BNC interface), used for external trigger synchronization
The Remote Interlock terminal of the interlocking interface requires a dedicated plug (A1288JA) to enable module output and ensure safety
GP-IB interface optional interface (requires module configuration), used for remote control of traditional instruments
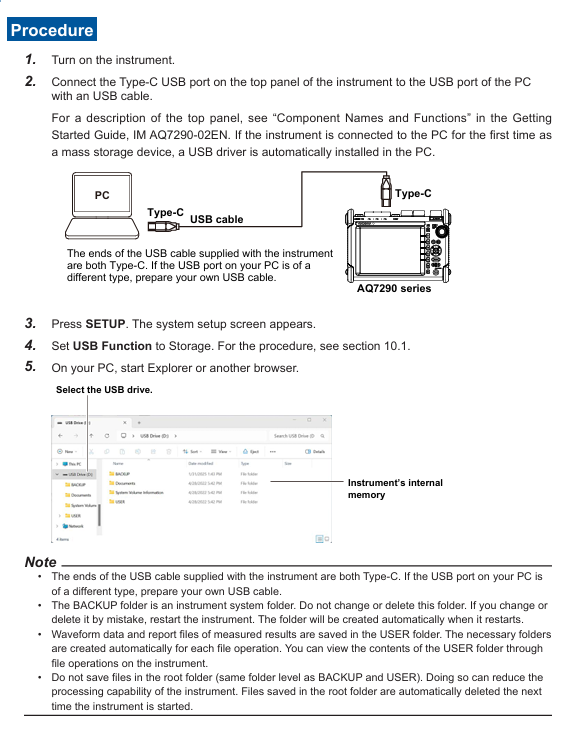
USB device interface USB Type-B interface, connected to PC for high-speed data transfer or remote control
Basic operation process
1. Startup and initialization settings
(1) Power on preparation
Hardware connection: Confirm that the framework is powered off, install the AQ23811A module (insert it into the slot rail and lock it), connect the AC power cord, and turn on the power switch on the rear panel.
Self check and startup: automatic framework detection module after startup DRAM、 File system, after passing self-test, enters the main interface (summary view); If the self-test fails (such as module not recognized), the screen will display an error code (such as E021: Slot 1 module abnormal), and the module needs to be reinstalled or repaired.
Restore default settings: Press the “Function icon” → “System” → “Reset Frame to factory default” in the upper left corner of the screen, confirm and restore the factory settings (source output turned off, measurement mode default voltage, trigger source set to None).
(2) Module calibration (key steps)
When the AQ23811A module is used for the first time or when the ambient temperature changes by more than ± 10 ℃, zero calibration needs to be performed:
Disconnect the external wiring of the module output terminal to ensure no load connection.
In the summary view, long press the module name (such as “AQ23811A SMU”) → a pop-up menu → select “CH1 ZeroSet” or “CH2 ZeroSet”.
Wait for calibration to complete (about 3-5 seconds), the screen displays “ZeroSet OK”, and after calibration, the source output offset error is ≤± 10 μ V (voltage)/± 1 pA (current).
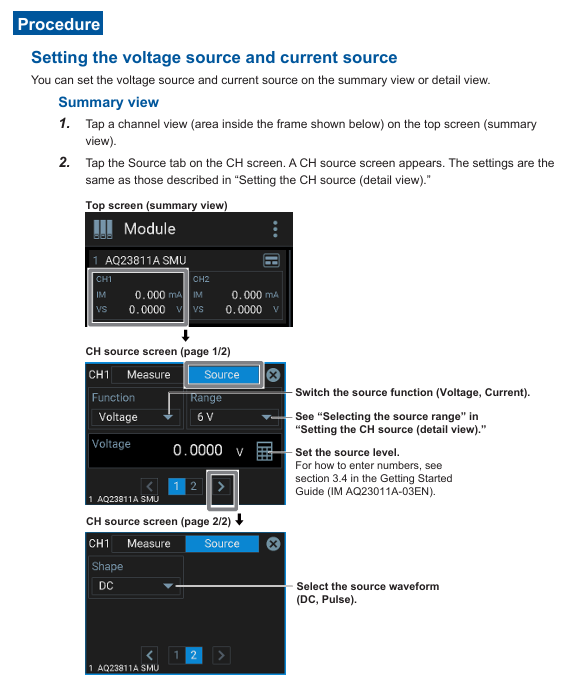
2. Source output and measurement settings (taking AQ23811A CH1 as an example)
(1) Voltage source output setting
In the summary view, click on the CH1 channel area → switch to the “Source” tab.
Set parameters:
Function: Select “Voltage”.
Range: default “6 V” (only 1st gear), no need to manually switch (automatic range is consistent with fixed range).
Source level: Input target voltage (e.g. 3.3000 V, resolution 100 μ V).
Shape: Select “DC” or “Pulse” (pulse, additional pulse width and base level need to be set).
Limit: Set the maximum output current (such as 100.000 mA to prevent load overload).
Enable output: In the detail view, click the “OUTPUT” button (long press for 2 seconds). The button turns green to indicate that the output is turned on, and the CH1 terminal outputs the set voltage.
(2) Current measurement settings
Keep the CH1 output connected to the tested load, click on the CH1 channel area in the summary view → switch to the “Measure” tab.
Set parameters:
Measurement type: default “Current” (current measurement, voltage measurement automatically turned on to calculate power).
Wiring method (Wire): Select “2wire” (two-wire system, ordinary measurement) or “4wire” (four wire system, high-precision low resistance measurement).
Integral Time: Set 1 PLC (20 ms for 50 Hz grid and 16.67 ms for 60 Hz grid) to reduce power supply noise interference.
Measure Delay: Set to 10 μ s and ensure stable load before collecting data.
View results: The summary view displays the real-time measured current of CH1 (such as 50.123 mA), and pressing the “Math” key can display the calculated power (voltage x current) or resistance (voltage/current).
3. Scanning function operation (linear scanning example)
Taking “CH1 voltage linearly scanned from 0 V to 5 V, step size 0.1 V, synchronous measurement of load current” as an example:
Enter scanning settings: Press “Function icon” → “Application” → “Sweep” → select “Linear Sweep”.
Configure scanning parameters:
Scan channel (Sweep CH): Select “AQ23811A CH1”.
Measure CH: Check “AQ23811A CH1” for measuring current.
Scanning range: Start Level 0 V, Stop Level 5 V, Step Level 0.1 V.
Trigger settings: Set the Start Trigger to “None” (immediate start) and the Step Trigger to “Cyclic” (triggered by an internal timer with an interval of 100 ms).
Start scanning: Click the “Start” button (long press for 2 seconds), the screen displays the scanning progress (steps, expired time), and the measurement data is automatically saved to internal storage (default CSV format).
View results: After scanning is complete, press “File” ->”Internal memory” ->view the “sweet_xxx. csv” file, which contains the voltage, current, and power values for each step.
Core functions and advanced operations
1. Trigger function (precise synchronization signal)
The AQ2300 series supports multiple types of triggering, ensuring that source output or measurement is initiated under specific conditions. The core triggering modes are as follows:
Trigger type functional characteristics and applicable scenario operation examples
Bus triggering utilizes the framework bus (BUS Trigger1-9) to synchronize multiple modules, supporting external trigger signals (Trig IN1/Trig IN2) or internal timers. Set BUS Trigger1 to “Trig IN1” and CH1 source trigger to “BUS Trigger1”, and start voltage output when external signals trigger
Source change triggers measurement when the source level changes (Src Change), suitable for capturing the dynamic response of the load CH1. When the source level jumps from 1 V to 2 V, it automatically triggers current measurement and records the current changes before and after the jump
Periodic triggering: Repeat the triggering measurement at a fixed cycle (minimum 1 ms), suitable for long-term stability monitoring. Set the “Cyclic” triggering cycle to 1 s, measure continuously for 1 hour, and analyze the load current drift situation
Scan start trigger: Wait for an external trigger (such as Trig IN2) before starting the scan, suitable for multi device synchronous testing. Set the scan start trigger to “Trig IN2”, and only start voltage scanning after the external signal is triggered, synchronously collecting oscilloscope waveforms
2. File operation (data management)
(1) Data saving types and formats
Data Type Format and Usage Save Operation
Measure data BIN (binary, high-precision, small space occupation), CSV (text, can be imported into Excel for analysis) in the detail view, press “Store” ->set the number of collection points (such as 100 points) ->”Save Store Data” ->select the storage path
Configuration files. 811 (module configuration) and. FRM (framework configuration) are used to save the current parameters. Next time, long press the module name ->”Save Setup” ->name the file (such as “SMUFHIR 1_3V. set”) ->save to a USB drive
Screenshot PNG (image format, resolution 1280 × 800), used for report recording. Press “Function icon” → “Take a Screenshot” and automatically name it “AQ2300_SC_000. PNG” to save to internal storage
Error log (text), automatically records hardware failures and operational errors, used for troubleshooting framework to automatically save, export to USB drive by pressing “System” → “System Log” → “Save System Log File”
(2) File management operations
Folder creation: Press “File” ->”Location” ->select “USB Storage” ->”Create new folder” ->Name (e.g. “Test_202410”).
File copying/deleting: Select the file (such as “sweet_001. csv”) ->click on the menu on the right side of the file ->select “Copy” ->select the destination folder ->”Paste”; The deletion operation is similar and requires confirmation of a second prompt.
File filtering: In the file list interface, enter filtering criteria (such as “*. csv”) to display only CSV format files and quickly locate the target data.
3. System settings (remote control and security)
(1) Remote control configuration
Supports four remote control methods: RawSocket, HiSLIP, GP-IB, and USB. Taking Ethernet as an example:
Press “Function icon” → “System” → “Network” → “IPv4” → Set to “DHCP ON” (automatically obtain IP) or manually enter (e.g. IP: 192.168.1.100, subnet mask: 255.255.255.0).
Configure remote protocol: “Remote” → “Function” Select “HiSLIP” → Set port (default 4880), encryption (Encryption OFF/ON, select as needed).
PC control: Install the NI-VISA driver and use LabVIEW/Python to send SCPI commands (such as “SOURce1: CHANnel1: VOLTage: LEVel 3.3” to set CH1 output to 3.3 V).
(2) Safety interlock setting
To prevent damage to the load caused by misoperation, the interlocking function needs to be activated:
Connect the “Remote Interlock” terminal on the rear panel to the dedicated plug (A1288JA).
Press “System” → “Inter Lock” → Set to “Locked”, and the module output will be disabled; You need to enter the default password “12345” → set it to “Unlocked” to enable output.
Password management: It can be modified through “Reset Password” (default) or “Change Password” (custom password, 6-12 digits) to enhance security.
Maintenance and troubleshooting
1. Daily maintenance
Cleaning: Wipe the display screen and housing with a dry soft cloth. If there is dust on the BNC terminal and USB interface, blow it off with compressed air (pressure ≤ 0.3 MPa); Prohibit the use of solvents such as alcohol and acetone to avoid damaging the coating.
Module maintenance: Regularly check whether the module is in close contact with the slot (once a month), and when not in use for a long time, turn on the power for 1 hour every month to prevent capacitor aging.
Calibration cycle: It is recommended to send it to the authorized service center of Yokogawa for calibration once a year, or use a standard source (such as Yokogawa 7520 calibrator) for self calibration to ensure that the accuracy meets the requirements.
2. Troubleshooting
Possible causes and solutions for the fault phenomenon
Unrecognized module not locked, poor slot contact, module failure. Re plug and lock the module, replace the slot for testing; If still not identified, contact maintenance
Source output voltage interlock not unlocked, output not enabled, current limit value set to 0, load short circuit unlock interlock, long press “OUTPUT” to enable output, check current limit value (set to ≥ 1 mA), check load wiring
The measurement value fluctuates greatly, the integration time is too short, the wiring is loose, and the power supply noise interference increases the integration time (such as 10 PLC). Check the wiring (ensure good contact of the sense line in the four wire system) and stay away from interference sources such as frequency converters
USB cannot read USB flash drive format not supported (FAT32/NTFS required), poor interface contact, damaged USB flash drive, formatted USB flash drive as FAT32, re plug and unplug USB flash drive, replace USB flash drive for testing
Remote control failed due to IP address mismatch, protocol not enabled, firewall interception confirmation framework on the same network segment as PC, HiSLIP/RawSocket protocol enabled, PC firewall disabled
3. System self-test and logging
Self check operation: Press “System” ->”Self Test” ->select “DRAM Test”, “File System Test”, “Battery Test” ->”Start”. The self-test result shows “Pass/Tail”. If it fails, please contact maintenance.
Log viewing: Press “System” → “System Log” to view system logs (such as module installation time, firmware update records) and user logs (such as operation error codes). The logs can be exported in ZIP format and saved to a USB drive for maintenance analysis.