Call us 24/7uaedcs@163.com
Welcome to the official website of CNIACS Automation Technology Co., Ltd!
Call us 24/7uaedcs@163.com

ZYGO MetroPro 9.0 Reference Guide (OMP-0347M)

Software Fundamentals and Core Architecture

1. Basic Information and Document System

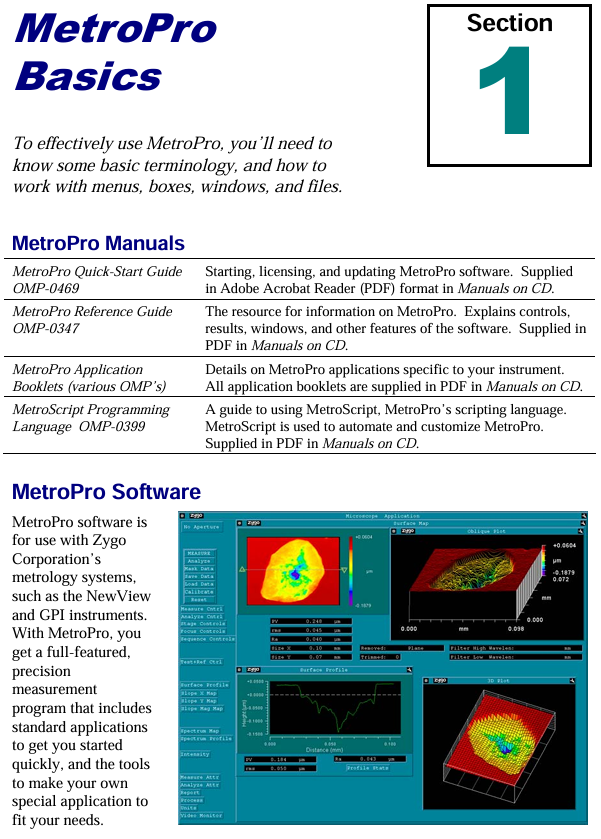
Software positioning: Suitable for Zygo precision optical measurement equipment, providing data acquisition, analysis, visualization, and automation functions, supporting custom application configuration to adapt to different measurement scenarios (such as surface morphology, roughness, wavefront analysis).

Version history: From version 4.0 in 1993 to version 9.0 in 2011, the manual revision records cover functional updates in each version (such as the addition of FDA high-resolution analysis in version 7.10 and optimized pattern editor in version 8.0).

2. Software architecture and hierarchical logic

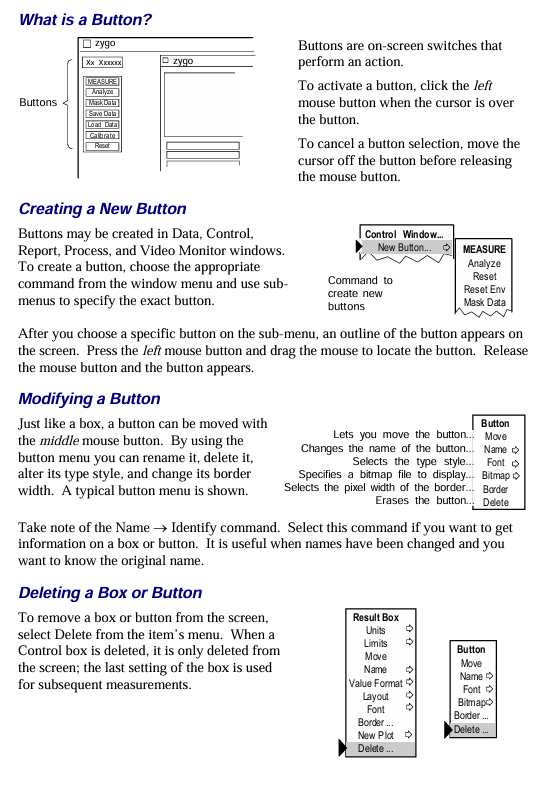
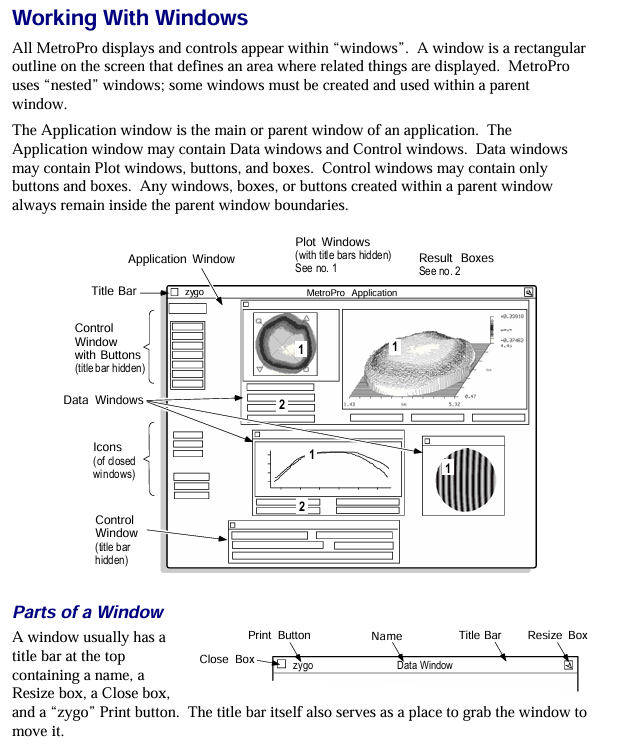
MetroPro adopts a nested window structure, with each component nested in a hierarchical order of “MetroPro main window → application window → function window (control/data/drawing, etc.)”. The core components are defined as follows:

Component Type Core Function Example

The top-level interface of MetroPro main window software after startup, which can load/create multiple application windows and display loaded application icons (such as Micro. app)

Application Window is a set of configurations for specific measurement tasks, including sub windows for surface morphology measurement applications such as control and data (including objective control and data display windows)

Control Window manages measurement parameters (such as laser power, scanning mode), triggering operations (measurement/calibration), including the “MEASURE” button and laser intensity control slider

The Data Window displays measurement data, supports plotting (3D/profile), and displays numerical results including filled plots and profile result tables

Plot Window data visualization tools, such as fill plots (surface morphology), profile plots (2D contour), 3D model plots, power spectral density plots (PSD)

Controls/Buttons control parameter adjustment (such as filter type, unit selection), trigger specific function “Auto Focus” button, “Filter Type” dropdown control

3. Basic operating standards

Keyboard and Mouse Operations:

Shortcut keys: F1 triggers measurement, F5 automatically adjusts light intensity, Ctrl+Alt+Delete exits software;

Mouse functions: right-click to bring up menus, middle click to move windows, left click to select/trigger (such as button clicking, text input).

File Management

Supports 10 core file formats, including application configuration (. app), measurement data (. dat), mask (. mas), script (. scr), etc;

File naming convention: The first character is a letter/number, supporting underscores and periods, with a maximum length of 20 characters (after version 7.4). It is recommended to add an extension (such as “Sample01. dat”);

Directory operation: Create/switch directories through the “File Handler” dialog box, supporting cross drive file access.

Window Control: Supports window movement, scaling, cascading, and closing (converted to icons), and can be hidden, renamed, deleted, and other operations through the “Window Control” menu.

Detailed explanation of core functional modules

1. Working with Applications

The application is the core task unit of MetroPro, which can be customized to meet different measurement needs. The core operations include:

(1) Application type and loading

Type classification:

Standard application: Pre installed software (such as “Micro. app” for microscopic measurement), write protected, needs to be copied and modified through the user directory;

Custom application: Modify based on existing applications (such as adjusting control positions, adding new drawings) or create from scratch.

Loading process: Right click on the MetroPro main window menu ->”Load Application”, select the. app file in the file browser, and support loading multiple applications simultaneously (up to 3 can be opened at the same time).

(2) Application configuration and saving

Core component configuration:

Control window: Add measurement parameter controls (such as objective lens selection, scan length), function buttons (such as “Calibrate” calibration);

Data window: Add plots (such as fill plots, profile plots), result value boxes (such as PV values, RMS values);

Other windows: Report window (generate measurement report), Video monitoring window (real-time display of measurement area).

Save rules:

Save Application “: Specify a name and path when saving for the first time (such as” Customs Surface. app “);

Re save Application “: Overwrite the current application configuration without the need to reselect the path;

Lock application: Press Ctrl+Shift+L to lock the application (to prevent accidental changes), supports password protection (4-13 letters/numbers).

2. Mask Editor

Masks are used to define measurement areas (including/excluding specific areas), supporting 4 types of masks and adapting to different measurement scenarios:

(1) Mask type and function

The core role of mask types in application scenarios

Default (default mask) takes effect by default when no other masks are defined for regular measurements, covering the entire camera field of view

Eliminate interference areas (such as edge diffraction and low reflectivity areas) during the data acquisition phase of the Acquisition mask to reduce data volume and improve speed

Test/Reference Mask Area Comparison Measurement defines “test area” and “reference area”, used for analyzing differences in different areas of the same part (such as surface flatness comparison)

(2) Mask creation and editing

Basic operation: Click the “Mask Data” button to open the editor, which supports drawing shapes such as circles, rectangles, polygons, etc. Use “Fill/Fill” to control whether the area is included in the analysis (the filled area is the valid area);

Advanced features:

Auto Aperture: Automatically generate circular/rectangular masks based on data, and can set the center position (such as data centroid, fixed coordinates) and the ratio of inner and outer diameters;

Fiducials: Define reference marker points for aligning parts (such as position calibration when assembling multiple data sets), and support saving as. gid files for reuse.

3. Pattern Editor

For instruments with programmable motor stages, used to define automatic measurement position sequences, supporting 3 types of pattern types:

(1) Pattern type and parameters

Pattern type applicable scenario core parameters

Rectangular regular array measurement (such as multiple chips on a wafer) includes row/column count, row/column spacing, and motion sequence (snake/grating)

Circular area measurement (such as lens surface) includes the number of circles, the number of radial points, and the radius range (Radius 1/Radius 2)

Free Rect irregular position measurement manual addition/editing of position coordinates, supports online (capturing position after stage movement)/offline (directly inputting coordinates) creation

(2) Pattern operation and control

Run settings: Specify the operation (measurement/run script), pause time (Pre Pause/Post Pause), and error handling (retry/skip/terminate) for each location;

Position management: Edit the position (including/excluding specific points) through the “Position Editor”, and view the measurement status of each position through the “Position Status” (identified by code: P=qualified, F=failed,?)? =Unmeasured).

4. Drawing function (Filled Plot&Profile Plot)

Drawing is the core of data visualization, and the most commonly used “Filled Plot” and “Profile Plot” are used in conjunction to cover 3D surfaces and 2D contour analysis

(1) Filled Plot

Functional positioning: Display 3D surface morphology and distinguish height differences by color (such as spectral colors representing different height ranges);

Controller function:

Color settings: Supports 16 color bands, grayscale, CMYK, and other color schemes. “Color Fit” optimizes the display of data with a high proportion of a single color;

Slice tool: Draw linear/radial/circular slices, define the analysis path of the cross-sectional view;

Show PV: Mark the highest (Peak) and lowest (Valley) points on the surface to display the PV value;

Limit display: Combined with the upper and lower limits of PV results, it is highlighted in red when exceeding the limit.

(2) Profile Plot

Function positioning: Display the 2D height contour on the slicing path, support precise numerical analysis;

Core operation:

Axis scaling: Fixed X/Y axis range (such as Y-axis set to 0-100nm), or automatically adapted to data range;

Inspection tool: Move the crosshair to read the coordinates of any point (X=distance, Y=height), calculate the distance between two points (xDst) and the height difference (yDst);

Result export: Export profile data as text (CSV/Tab separated) or images (BMP/CIF).

5. Instrument Control

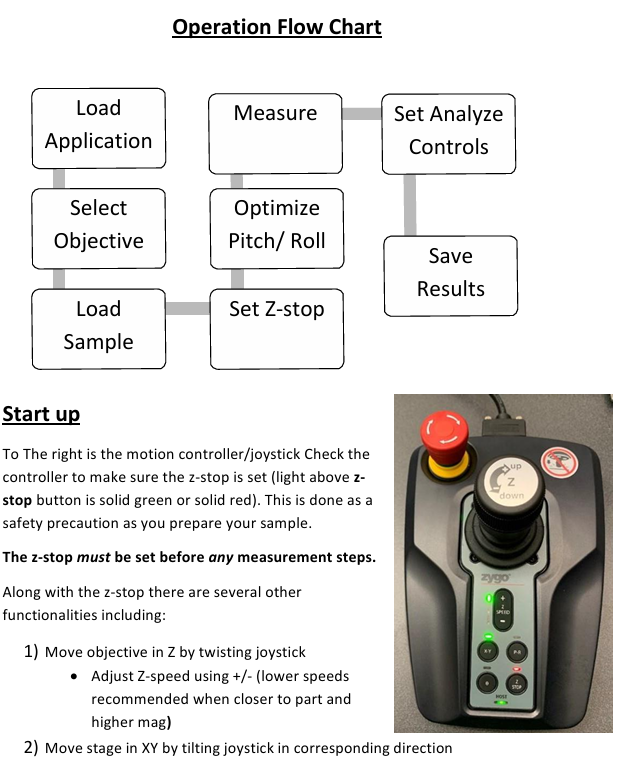
Covering key operations such as equipment calibration, error correction, and light intensity adjustment to ensure measurement accuracy:

(1) Automatic function

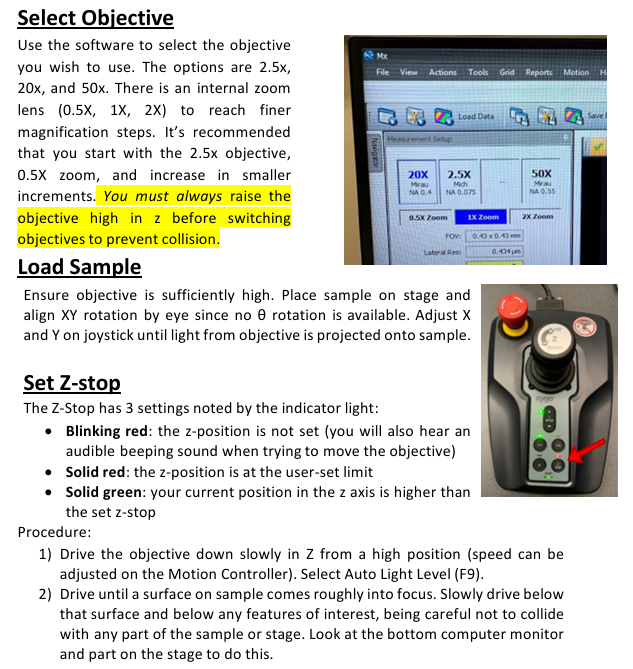
Auto Focus: Suitable for devices with a Z-axis motor, set the focus range through “Focus Max Adjust” and the minimum modulation threshold through “Focus Min Mod” to ensure focus accuracy;

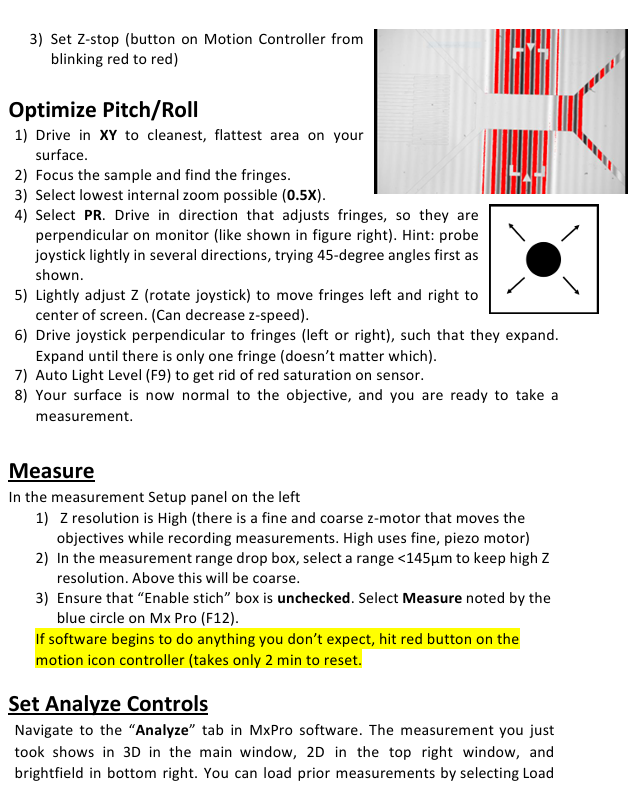
Auto Tilt: For platforms with pitch/roll motors, adjust the angle of the parts to reduce stripe tilt, and set the “Auto Tilt Iterations” adjustment frequency (recommended 2-3 times to ensure convergence);

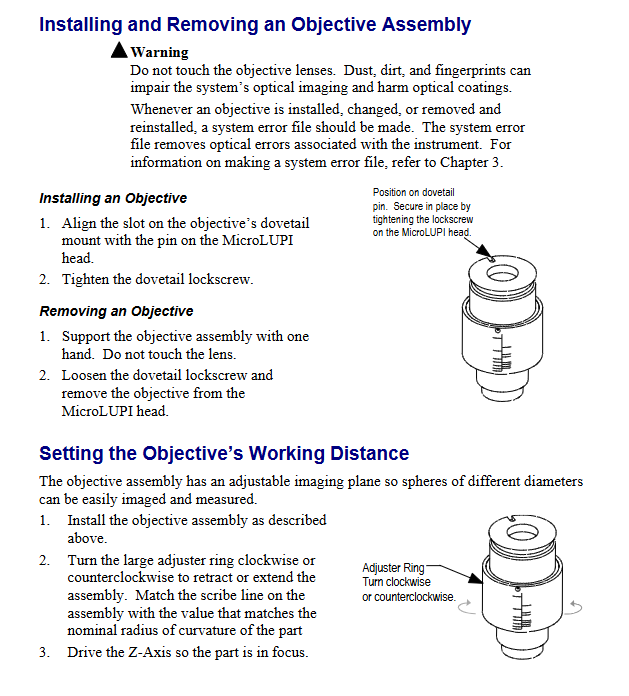
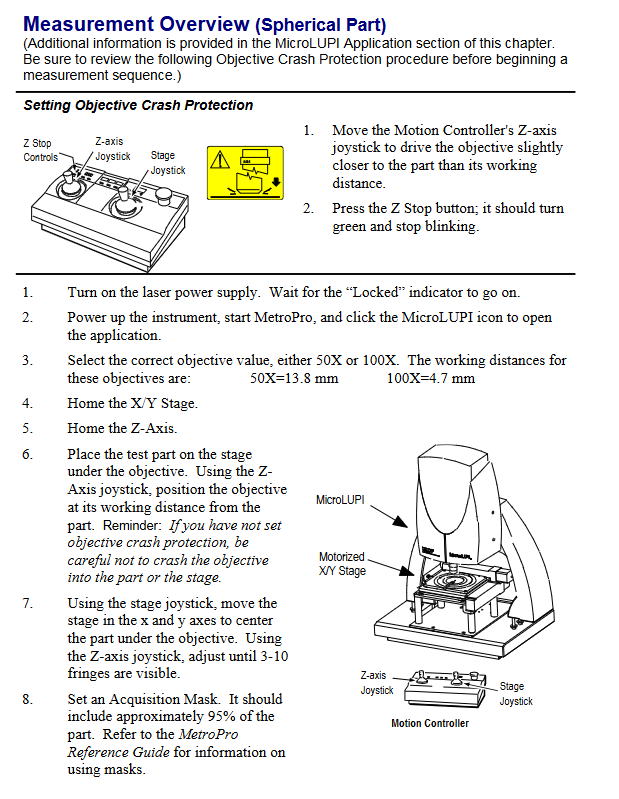
Auto null: Used for measuring spherical parts, adjusting the X/Y/Z axes to minimize interference fringes, requires inputting the nominal radius of curvature (RadCrv) of the spherical surface.

(2) Calibration and Error Correction

Lateral Calibration:

Purpose: To establish a correspondence between camera pixels and actual length (e.g. 1 pixel=2.5 μ m), Zygo standard calibration parts are required;

Process: Draw a calibration line in the “Lateral Calibrator” window, enter the actual length (such as 1mm), and save the calibration parameters;

System Error Correction:

Method: Measure high-precision standard components (such as reference planes with ≤ 2 Å RMS), save them as a system error file (. dat), and enable error subtraction through the “Abstract Sys Err” control;

Applicable scenarios: Eliminate the inherent aberrations of the instrument (such as optical system errors in interferometers) and improve measurement accuracy.

(3) Light intensity control

Manual adjustment: Press F4 to open the light intensity window, use the+/- (fine) and */(coarse) keys to adjust, ensuring that the saturation pixels are below the threshold (default ≤ 4);

Automatic adjustment: Press F5 to start AGC (automatic gain control), automatically adapt the reflectivity of the parts, optimize the signal-to-noise ratio, and set the “Target Range” with a safety margin for light intensity saturation (default 0.1).

Data processing and result output

1. Data format and conversion

Support import/export of multiple data formats, suitable for different analysis scenarios:

Binary format:. dat (raw measurement data, including phase/intensity matrix),. app (application configuration),. mas (mask);

Text formats:. csv (comma separated, used for Excel analysis),. rep (report file),. zfr (Zernike polynomial, CODE V format);

Universal format: Supports interaction with optical design software, such as CODE V (. wfr/. sur), ZEMAX (grid height data), OSLO compatible files.

2. Results and Reports

Result types: covering surface morphology (PV, RMS, Ra), wavefront analysis (Zernike coefficient, Seidel coefficient), geometric parameters (curvature radius, tilt angle), etc., supporting custom result units (imperial/metric/optical units such as wavelength);

Report generation:

Report Window: Add result values, attributes (such as measurement time, operator ID), and comment text, and save them as. rp files;

Q-DAS report: compatible with Q-DAS quality analysis system, supporting Gage Type 1/3 studies (measurement system repeatability analysis), outputting. dfq (merged files) or. dfd/. dfx (split header/data files).

Key Terminology Annotations

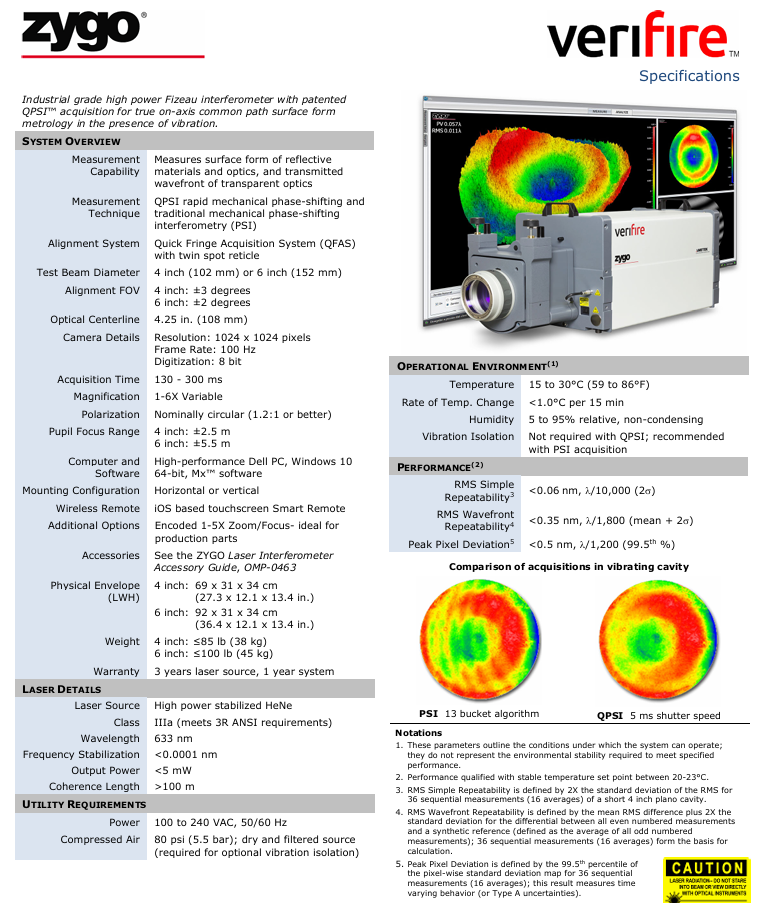
QPSI ™: Zygo’s patented fast phase-shift interferometry technology, with a shutter speed of 5ms, strong anti vibration ability, and no need for complex isolation;

FDA (Frequency Domain Analysis): Frequency domain analysis technology used in white light scanning interferometers to extract multi wavelength phase information through Fourier transform and solve the 2 π phase ambiguity problem;

Zernike Polynomials: Used for fitting wavefront errors, MetroPro supports 37 terms (Coef 0-Coef 36) and can be exported in CODE V format;

BRDF(Bidirectional Reflectance Distribution Function): Bi directional reflection distribution function, used to analyze surface reflection characteristics, requires input of incident angle and scattering angle.

Zygo Device Standard Operating Procedure (SOP)

Core operating prerequisites and safety warnings

Core safety mechanism: The Z-axis limit (Z-stop) of the Motion Controller is a critical safety protection, and it must be confirmed that it has been set (the indicator light is constantly green or red) before all measurement steps to prevent collision between the objective lens and the sample/stage.

Emergency operation: If an abnormality occurs, immediately press the “Emergency Off” button on the motion controller, and the device will need to perform the “Homing” operation again in the future.

Complete operational process

1. Startup and initialization (Start Up)

(1) Inspection of motion controller

Confirm Z-stop status: The indicator light should be constantly on green/red. If it flashes red and accompanied by a beep, it needs to be reset (detailed steps to follow).

Familiar with controller functions:

Precautions for functional operation mode

When the Z-axis objective lens moves and rotates the Joystick near the sample or at high magnification, use low speed (adjusted by the “+/-” keys)

XY axis stage movement tilt control lever (need to select the “XY” button, corresponding green light on) is used for rough positioning of the sample to ensure that the objective beam is projected onto the sample

Pitch/Roll (P/R) adjustment tilt control lever (the “PR” button needs to be selected, corresponding green light is on) P (pitch), R (roll) maximum adjustment range ± 2 °, θ (rotation) function is invalid

(2) Software startup and application loading

Login to the computer: Enter the username “Zygo” and press Enter to enter the system.

Open the Mx software: Start the Mx program from the desktop, go to “File” ->”Load Application”, and load the “Micro. appx” application (the application list also includes other. appx files such as roughness measurement and low-pass filtering, which need to be selected accurately).

Instrument parameter initialization: After loading the application, a “F-stop/A-stop” setting window will pop up. Please confirm:

F-stop (aperture): in the “Open” state (locked by pressing the knob);

A-stop (aperture stop): in the “Open” state (locked by pressing the knob);

Filter: Set to “F1 (Measure)”, click “OK” to confirm.

2. Sample and objective lens preparation

(1) Objective selection and switching

Optional objective lenses: 2.5X (NA 0.075), 20X (NA 0.55), 50X, paired with an internal zoom lens (0.5X/1X/2X) for fine magnification adjustment.

Switching principle:

Initial recommendation is to use a “2.5X objective lens+0.5X zoom” and gradually increase the magnification (to avoid collisions caused by using high magnification directly);

Before switching the objective lens, it must be raised to the highest position along the Z-axis to prevent collision with the sample.

(2) Load Sample

Confirm that the objective lens has been raised to a high position and place the sample on the stage;

Roughly adjust the XY direction rotation of the sample with the naked eye (the device does not have a θ rotation function);

Tilt the XY joystick and move the stage until the beam emitted by the objective lens is projected onto the surface of the sample.

(3) Z-stop setting (core security steps)

Slowly lower the objective lens from the Z-axis high position (adjust the controller speed, slightly faster in the initial stage, and slow down when approaching the sample), press “F9” to start “Auto Light Level”;

Continue to lower the objective lens until the sample surface is roughly in focus, and then slowly lower it to the position of “all features below the target measurement area” (combined with the display below and visual observation to avoid collision);

Press the “Z-stop” button on the motion controller, and the indicator light will change from flashing red to constantly on red, completing the setting (at this time, the lowest position of the Z-axis is locked).

3. Calibration before measurement (optimizing pitch/roll)

By adjusting the P/R (pitch/roll), ensure that the sample surface is perpendicular to the objective lens. The steps are as follows:

Move the XY stage to move the “smoothest and cleanest area” of the sample directly below the objective lens;

Focus on the sample and find the interference fringes, switch to the lowest internal zoom (0.5X) for easy observation of the fringes;

Select the “PR” button (green light on), lightly touch the joystick (try 45 ° direction first), and adjust the stripes to be perpendicular to the monitor;

Fine tune the Z-axis (rotate the joystick to reduce speed) and move the stripes to the center of the screen;

Tilt the joystick in the direction perpendicular to the stripes to expand them until only one stripe remains on the screen (direction not limited);

Press “F9” again to perform automatic light intensity adjustment, eliminate sensor red saturation, and complete calibration.

4. Perform Measurement

(1) Measurement parameter settings

Configure in the left “Measurement Setup” panel:

Z resolution: set to “High” (enable fine piezoelectric motor to ensure accuracy);

Measurement Range: Select a range of<145 μ m (if exceeded, it will automatically switch to coarse precision mode);

Enable Stitch function: Uncheck (default off to avoid multi area stitching errors).

(2) Start measurement

Click the blue “Measure” button in the Mx software (or press “F12”);

Exception handling: If the software performs an unexpected operation, immediately press the red emergency button on the motion controller to reset the device (approximately 2 minutes).

5. Data Processing (Set Analyze Controls)

After the measurement is completed, the data will be displayed in “3D view (main window), 2D view (upper right window), bright field image (lower right window)”, and horizontal correction needs to be performed through post-processing:

(1) 2D horizontal correction (applicable for profile analysis)

Right click on the 3D image in the main window and select “2D” to switch views;

Select the “Linear” option at the top of the window, click on two points on the image, and determine the profile to be analyzed (the profile curve will be automatically generated below);

Right click on the profile curve and add “Inspector 1” and “Inspector 2” in sequence;

Move the Inspector to the baseline surface, right-click and select “Level” to complete the calibration.

(2) 3D horizontal correction (applicable to overall surface analysis)

In the “Surface” panel on the left, click on “Surface Processing” (a settings window will pop up);

Check the “Immediate Update” and “Use Fit Mask” options in the bottom left corner, and click on “Mask Editor”;

Check ‘Form Remove’ and draw a geometric shape to frame the surface shape to be removed (such as protrusions and depressions);

Close the “Mask Editor” and “Surface Processing” windows, and the correction effect will be automatically applied to the 3D data.

6. Save Results&Clean Up

(1) Save Results

Raw data (. datax format): Use “File” → “Save Data” to save to the “Data (D:) \ ZygoData” folder on drive D;

Image/Table Export: Right click on any chart and select “Export” to export the image as an image format or the 2D section as a. csv file.

(2) Shutdown process

Raise the objective lens: Raise the objective lens to the highest position along the Z-axis and reset the Z-stop (press the button until the indicator light stays on in red);

Software and System Shutdown: Close the Mx software, exit the “Zygo” account, and turn off the monitor;

Record and report: Sign in the experimental log book. If any errors occur during use, take a screenshot and save it to the data folder, and indicate the fault situation in the log.

Key precautions

Collision protection: All operations involving Z-axis movement (switching objectives, loading samples, setting Z-stop) must ensure sufficient safety distance between the objective and the sample, and prioritize the lowest speed when high magnification (50X);

Magnification selection logic: Starting from low magnification (2.5X+0.5X), gradually increasing to avoid using high magnification directly causing “sample not found” or collision;

Data storage standard: The. datax original file should be named with “sample name+date”, and screenshots and. csv files should be associated with the original data for easy traceability in the future;

Priority of exception handling: In case of equipment failure, press the emergency button first, and then record the fault phenomenon (screenshot+text description). It is prohibited to disassemble or modify software parameters by oneself.

Zygo Verify Laser Interferometer

Core positioning and technological highlights of the product

Zygo Verify is an industrial grade high-power Fizo interferometer, with the core advantage of being equipped with patented QPSI ™ The (Fast Phase Shift Interference) acquisition technology can achieve true coaxial common optical path surface morphology measurement in vibration environments, and is compatible with the traditional PSI (Phase Shift Interference) 13 bucket algorithm, balancing measurement accuracy and anti-interference ability. It is suitable for surface morphology detection scenarios of precision optical components.

Key system parameters

1. Optics and acquisition system

Parameter category 4-inch (102mm) model 6-inch (152mm) model supplementary explanation

Test beam diameter of 4 inches and 6 inches to meet the detection requirements of optical components of different sizes

Align the field of view (FOV) ± 3 degrees ± 2 degrees to assist in rapid positioning of the test piece and ensure alignment of the optical path

The optical centerline distance is 4.25 inches (108mm), and the fixed size is 4.25 inches (108mm) to ensure the stability of the measurement optical path

Camera parameter resolution 1024 × 1024 pixels, 8-bit digitization, frame rate 100Hz, same as 4-inch model, high frame rate supports fast data acquisition, 8-bit digitization ensures grayscale accuracy

Collection time 130-300ms 130-300ms Fast response improves detection efficiency

The magnification can be adjusted from 1 to 6 times, and the observation accuracy can be adjusted according to the detailed requirements of the measured object

Polarization pupil close to circular (1.2:1 or better) ensures beam polarization consistency and reduces measurement errors

Focusing range ± 2.5m ± 5.5m. The 6-inch model has a wider focusing range and is suitable for large-sized components

2. Laser source parameters

Type: High power stable helium neon (HeNe) laser, compliant with ANSI Class 3R safety requirements (Class IIIa)

Wavelength: 633nm (red light band, suitable for most optical component reflection/transmission measurements)

Frequency stability: < 0.0001nm, extremely low frequency drift ensures long-term measurement accuracy

Output power:<5mW, high power enhances signal strength, compatible with low reflectivity components

Coherence length:>100m, long coherence length supports large optical path difference measurement scenarios

Operating environment requirements

Remarks on specific requirements for environmental indicators

Stable operation is required within the temperature range of 15-30 ℃ (59-86 ℉). If performance indicators need to be met, it is recommended to set the temperature at 20-23 ℃ (performance verification reference temperature)

Temperature change rate<1.0 ℃/15 minutes to avoid rapid temperature changes that may cause thermal expansion and contraction of equipment components, affecting measurement accuracy

Humidity 5% -95% relative humidity, no condensation to prevent moisture from causing mold on optical components and short circuits in electronic components

Under vibration isolation QPSI technology, no additional vibration isolation is required; It is recommended to configure QPSI technology as the core anti vibration advantage in PSI acquisition mode to reduce the vibration control requirements for the installation environment

Measurement performance indicators (based on a stable temperature environment of 20-23 ℃)

Specific numerical definitions and calculation criteria for performance parameters

Perform 36 consecutive measurements (16 averages) on a 4-inch short planar cavity with RMS simple repeatability ³<0.06nm (λ/10000, 2 σ), and take 2 times the RMS standard deviation

RMS wavefront repeatability ⁴ < 0.35nm (λ/1800, mean+2 σ), the mean difference between all even numbered measurements and the “composite reference value of odd numbered measurement mean” in 36 consecutive measurements (16 averages), plus 2 times the standard deviation

In the pixel level standard deviation graph of 36 consecutive measurements (16 averages) with peak pixel deviation ⁵<0.5nm (λ/1200, 99.5 percentile), the deviation value corresponding to 99.5 percentile reflects the temporal variability (Class A uncertainty)

Physical and configuration information

1. Physical specifications

Model size (length x width x height) Weight

4 inches 69 × 31 × 34cm (27.3 × 12.1 × 13.4 inches) ≤ 85 pounds (38kg)

6 inches 92 × 31 × 34cm (36.4 × 12.1 × 13.4 inches) ≤ 100 pounds (45kg)

2. Hardware and software configuration

Computer: High performance Dell PC, equipped with Windows 10 system

Software: 64 bit Mx ™ Software that provides measurement control, data processing, and result analysis functions

Control accessories: iOS system touch screen intelligent remote control (wireless); 1-5 times zoom/focusing component with encoding (suitable for mass production part inspection)

Optional accessories: vibration isolation device (to be used with compressed air), other specialized testing accessories (see Zygo accessory guide for details)

3. Compressed air demand (optional for vibration isolation)

Pressure: 80psi (5.5bar)

Requirement: Dry and filtered air source to avoid moisture/impurities damaging vibration isolation components

Annotations on Core Terminology

QPSI ™: Zygo’s patented fast phase shifting interferometry technology has the core advantage of a 5ms shutter speed, strong anti vibration ability, and no need for complex vibration isolation environments.

PSI 13 bucket algorithm: The traditional 13 bucket phase shifting algorithm has high measurement accuracy, but is sensitive to environmental vibrations and needs to be used in a stable environment.

λ (wavelength): This specifically refers to the wavelength of the laser source at 633nm. “λ/XXX” in the performance indicators is a precise expression that is easy to understand (such as λ/10000, which is 633nm ÷ 10000 ≈ 0.063nm, consistent with RMS simple repeatability<0.06nm).

image.png

Zygo MicroLUPI interferometer

Product basic information

1. Product positioning and core functions

MicroLUPI is a micro aperture laser unequal path interferometer (LUPI) developed by Zygo. Based on phase-shift interferometry technology, it focuses on non-contact high-speed automated measurement of micro optical components, which can accurately detect the surface morphology and curvature radius of spherical/planar optical components. It also supports batch measurement of optical arrays and is equipped with a 3mm diameter collimated measurement beam. The core components include a granite base, a stable gantry column, an electric focusing mechanism, and an X/Y electric stage.

2. Optional configurations

Configuration items, specific parameters/instructions

Objective 50X SLWD (ultra long working distance), NA value 0.45 (usable 0.38); 100X SLWD, NA value 0.73

Laser wavelength standard 632.8nm, customizable blue to near-infrared band

Z-axis digital indicator incremental Z-axis length gauge, used for high-precision curvature radius measurement (standard on some models)

Vacuum suction cup suitable for 3/4/6 inch wafer fixed stage vacuum suction cup

3. Key technical parameters

Laser: Stable frequency helium neon laser (fiber output), power ≤ 1mW, coherence length ≥ 10m

Motion system: The X/Y stage and Z-axis focusing are both driven by DC brushless micro stepper motors, with a stroke of 152mm (6 inches), a resolution of 0.1 μ m (4 μ in), and a maximum speed of 12.7mm/s (0.5in/s)

Imaging and Observation: Maximum 640 × 480 pixel camera, 9-inch monochrome video monitor for real-time display, supports manual/auto focus

Environmental requirements: temperature 15-30 ℃ (59-86 ° F), temperature change rate<1.0 ℃/15 minutes, humidity 5% -95% (no condensation), vibration isolation frequency 1-120Hz

Laser safety: Complies with DHHS Class II laser standards, emits only visible red light, and has no visible radiation

Installation and initialization

1. Preparation before installation

Environmental requirements: Concrete floor should be used to reduce vibration, avoid air conditioning/fan direct blowing causing airflow disturbance, and stay away from optical pollution sources such as smoke and dust

**Utility requirements * *: 100-240VAC 50/60Hz power supply (with grounding), vibration isolation table requires ≥ 60psi compressed air (1/4 inch interface), vacuum suction cup requires 1/8 inch NPT interface vacuum source

Installation restriction: The device must be operated by Zygo trained personnel, and after opening the box, it must be left to stand in the installation environment for 24 hours to adapt to temperature and humidity

2. Core installation steps

Position the vibration isolation system and workbench, and install the granite base, column, Z-axis stage, and MicroLUPI machine head in sequence

Connect the laser power supply, motion controller, motor driver and other cables, ensure that the hardware key is connected to the parallel port of the computer, and the controller board cables are correctly connected

Install the objective lens (align with the dovetail groove pin and tighten the locking screw), adjust the working distance of the objective lens (match the engraved line according to the nominal curvature radius of the measured part)

Calibrate the machine head and X/Y stage: After removing the objective lens, place the optical flat mirror and adjust the X/Y axis adjustment screws to minimize the number of interference fringes

3. Startup initialization process

Turn on the laser power with the key and wait for the “Locked” indicator light to turn on; Turn on all components through the power manager

Log in to Windows NT on the computer (default username “zygo”), open MetroPro software and load MicroLUPI.app application

Perform X/Y stage and Z-axis “home” operation, set Z-axis collision protection (move the objective lens to a slightly smaller distance than the working distance, press the Z Stop button until the green light stays on)

Measurement operation process

1. Basic operation preparation

Controller usage: Adjust the height of the objective lens through the Z-axis joystick (push/pull to control lifting, deflection amplitude to control speed), move the stage with the X/Y joystick, and the emergency stop button (Motion Stop) can interrupt all movements

Light intensity adjustment: Press F4 to open the light intensity window, adjust all indicators to green through the numeric keypad (to avoid saturation and data loss), and F5 can automatically set the light intensity

2. System error calibration (key steps)

Calibration purpose: To eliminate inherent errors in the optical system of the instrument and improve measurement accuracy, recalibration is required after replacing the objective lens, adjusting the camera mode/phase resolution, or changing the ambient temperature

Operation steps:

Place the Zygo standard reference ball (avoid touching the optical surface), adjust X/Y/Z to align the center of the ball and hide the stripes

Set the average number of phase measurements in the measurement control window (recommended to be 3 times that of regular measurements, with a minimum of 8 times), and turn off “Subtext Sys Error”

After measuring with F1, save the data (named in a format such as “SysErrLN1x. dat” to distinguish between camera mode and phase resolution). During subsequent measurements, enable “Subtext Sys Error” and load the corresponding error file

3. Typical measurement scenarios (curvature radius of spherical parts)

Select the matching objective lens (50X working distance 13.8mm, 100X working distance 4.7mm), place the test piece and center it through the stage control lever

Enable AutoNULL (optional Power/Focus mode), set Lateral Pass Limit and Power/Focus Pass Limit

Click on “Auto Calibrate” to calibrate the X/Y/Z calibration coefficients (the fitting quality should be close to 1), and execute AutoNULL to optimize the stripes

Start measuring with F1, and the system automatically collects “cat’s eye” and “confocal” data to calculate the curvature radius; Batch measurement can create rectangular/circular measurement paths through the “Pattern Editor” (setting parameters such as row and column count, spacing, etc.)

Maintenance and after-sales service

1. Daily maintenance

Cleaning of optical components:

Dust: Blow off with compressed air, and wipe the remaining dust in one direction with lens paper dipped in isopropanol/methanol

Fingerprints/oil stains: Dip in 1% neutral soap solution to wipe, then use distilled water to remove residue, and finally finish with alcohol (do not reuse wiping materials)

Mechanical and electronic components: Use a soft cloth dipped in mild cleaner to wipe the external surface, and do not disassemble components such as motor drivers and controllers (no user repairable parts)

2. Malfunctions and after-sales service

Warranty Policy: The equipment comes with a 1-year warranty from the date of shipment (for material/process defects), standard support is provided for 5 years after discontinuation, and “best effort” support is provided thereafter; The warranty service includes free repair/replacement (with transportation, cleaning, and calibration fees to be borne), a 90 day warranty for replacement parts, or the remaining warranty period of the original warranty (whichever is longer)

Return requirement: Unused and well packaged products can be returned within 30 days, with a 20% restocking fee charged; Customized products cannot be returned, and returns must first obtain a Return Authorization (RA) number

Technical Support: In North America, you can call (800) 994-6669 (Monday to Friday 8:00-17:00 EST). In other regions, you need to provide the device model, serial number, and software version to contact the local agent

Safety and Compliance

1. Laser safety operation

Do not stare directly at the laser beam or its strong light reflection. When the device is turned on, ensure that the laser exit is unobstructed

Laser emission control: The key switch on the laser power supply is the main control (no radiation after turning off), and the “Emission Indicator” light is on to indicate that there may be laser output

Safety signs: The equipment is labeled with Class II laser warning signs (“CAUTION LASER RADATION DO NOT STARE IN BEAM”), exit port signs, non interlocking protective shell signs, etc., which must be kept clear and visible

2. Compliance certification

Compliant with the EU EMC Directive and Low Voltage Directive, meeting standards such as EN 55011 (ISM equipment RF interference), EN 61010-1 (safety of measuring equipment), EN 60825-1 (laser safety), etc

Having CE certification and JISO 9001 certification, the relevant conformity declaration is archived at Zygo’s US headquarters

ZYGO ZMI-1000 Displacement Measuring Interferometer System

The ZMI-1000 Displacement Measuring Interferometer provides both the tools and the performance needed to improve accuracy in precision motion systems.

Key Features

* Displacement resolutions up to 0.6 nm for excellent overlay and alignment capability.

* Measure motion at speeds up to 1.1 meter/second for increased throughput.

* Position measurements are time stamped for increased dynamic accuracy.

* Fiber optic system reduces the cost of remote receivers and eliminates heat in the measurement area.

* Cost-saving VME-based system electronics allow use of boards in standard VME backplanes.

High Resolution

Nano-technology applications in semiconductor production, data storage manufacturing, and precision machinery make high-resolution demands on motion measuring equipment. The ZMI-1000 responds with 0.6 nm resolution, made possible by a new electronic architecture and improved phase detection.

Precision at High Velocity

The patented 20-MHz heterodyne laser and ASIC-based phase detector allow the ZMI to maintain its 0.6 nm resolution at velocities up to 1.1 m/sec. And position measurements are time stamped for increased dynamic accuracy. Now, even the swiftest machines can be accurately controlled and characterized.

Six Axes, One Laser

Sub-micron positioning often requires simultaneous measurement of several degrees of freedom. Because an axis of the ZMI-1000 requires less than 1/30 of the laser’s optical power, simultaneous measurement of six axes requires only one laser head.

High Reliability Heterodyne

The ZMI overcomes the alignment difficulty and environmental sensitivity typical of single-frequency (DC) systems. Our patented, AOM-generated, two-frequency design provides the high reliability and ease of use required in precision motion applications. The ZMI’s 20 MHz frequency difference has ten times the bandwidth of older Zeeman systems, providing fast target speeds and precision time stamps lacking in other designs.

Solutions for the Real World

Measurement applications aren’t always in the controlled environment of a lab or limited to linear motions.With the ZMI-1000, you can measure linear displacements as small as 0.6 nm and as much as 20 meters, and angular rotations up to 60 degrees with 0.1 µrad resolution

Simple Dynamic Analysis with Position Oscilloscope Tools

To simplify the process of dynamic analysis, the ZMI contains internal functions designed to aid the process of dynamic motion characterization. Internal storage and trigger options allow the user to acquire a stream of position and time data up to 133 kHz. This data can then be analyzed with the assurance that each data point is accurate to nanometers, with time of the position known to 16 ns.

Need More Information?

If you have an application in mind and have some questions you would like answered by one of our applications engineers, or if you would simply like more information sent to you, click the “Talk to Zygo” link(below) and send us a note.

Zygo’s ZMI 2000 displacement measurement interferometer system

Displacement Measuring Interferometry improves positioning accuracy.  Zygo’s ZMI 2000 is the industry’s top performing Displacement Measuring Interferometer (DMI) System offering the highest resolution, the highest velocity, and lowest data age uncertainty for real time position control.  Zygo, a world-class interfero metric metrology company, supports you at all levels of design, engineering and manufacturing.  Zygo works as an extension of your research, engineering and  manufacturing teams in providing metrology solutions.

Performance Benefits of the ZMI 2000

• Positioning accuracy – Velocity and time dependent errors are eliminated.  All axes of motion are synchronized to an uncertainty of ≤1.7 ns.

•Overlay accuracy – λ/2048 resolution(0.31 nm) with 2 pass interferometers for excellent overlay and alignment capability.

• System throughput – Slew rates of 2.1 m/s with 2 pass interferometers enabled by the 20 MHz heterodyne split frequency.ZMI 2000 Systems are found in the most demanding feedback control applications:

• Lithography tools: optical steppers and scanners,e-beam and laser mask writers.

•Mask, wafer and LCD inspection and measurement tools, CD-SEM’s.

• Process equipment, memory repair tools.Integration Benefits of the ZMI 2000 for real-time position control

•Reduce heat, cost and ESD sensitivity, improved electrical isolation, and minimal package size 

Fiber optic cables are used on both the reference and measurement legs.

•Reduce cost in backplane space requirements

The ZMI 2002 offers two axes of interferometry on a single 6U VME board.

•Reduced design costs with simplified integration time – The measurement boards are fully programmable through the interface bus (VME or ISA), or the P2 interface.

•Reduced cost of integration – Standard hardware interfaces for up to 7.7 MHz P2 data rates for up to 16 axes.  Easily expanded to accommodate more axes at the same rates.

The ZMI 2000 as a Metrology System Unparalleled performance and flexibility.  All of the performance benefits of the ZMI 2000 with the following integration options:

• ZMI Systems Chassis with PCI-VME for processor speed real-time data,

• ZMI Systems Chassis with serial or GPIB interface for more cost effective solutions,

• ZMI PC for integration into an ISA slot.ZMI 2000 Systems are in use in Standards Labs worldwide for applications in measurement and calibration of high resolution and high frequency mechanical motions:

• Piezo transducer calibration,

• Linear Scale calibration,

• Rotary Scale calibration,

• AFM stage calibration.

The ZMI 2000 System Laser Head

The laser source may be the single most critical component of the Displacement Measuring Interferometer.  

To control and assure laser head quality, Zygo manufactures our own laser tubes.

The proprietary tube design, combined with a state-of-the-art assembly and test facility, provides for a highly reliable laser head with:

• > 50,000 hour lifetime,

• Longest basic warranty at 18 months,

• Extended warranties of up to 5 years,

• Up to 8 axes of interferometry on a single head,

• Multiple head synchronization.

ZMI 2000 System Integration Features

• Optical power monitor for the laser head output,and measurement board input.

• Built in laser head diagnostics.

• Position, time, and velocity, all available independently on the P2, or VMEbus.

• Programmable synchronization signal.

• Measurement boards can be used in any standard 6U VME or ISA backplane.

The ZMI 2000 System technology combined with our world-class opto-mechanical design and manufacturing center in Middlefield, CT makes Zygo Corporation a key partner in the successful design, manufacture, and integration of your real-time position control systems.

ZMI 2000 System Performance

4 Pass PMI*、 2 Pass PMI、1 Pass LI**

Position Resolution: λ/4096 (0.15 nm)、 λ/2048 (0.31 nm)、 λ/1024 (0.62 nm)

Position Range: ± 5.3 m、 ±10.6 m、± 21.2 m

Velocity Limit: 1.05 m/s、 2.1 m/s、 4.2 m/s

Maximum Acceleration:980 m/s2, (100 g)

Data Age: 335 ns

Data Age Uncertainty

Two Axes: Uncompensated, ±15 ns (ZMI 2001) / ±12 ns (ZMI 2002) / ± 16 ns (ZMI PC)

Compensated, ±1.2 ns (ZMI 2001, ZMI 2002)

Compensated, ±1.5 ns (ZMI PC)

Three Axes: Uncompensated, ±19 ns (ZMI PC)

Compensated, ±1.7 ns (ZMI PC)

Eight Axes: Uncompensated, ±36 ns (ZMI 2001) / 22 ns (ZMI 2002)

Compensated, ±1.4 ns (ZMI 2001, ZMI 2002)

ZMI 2000 System Laser Head

Type:HeNe, cw, two frequency

Power Minimum / Typical: 425 µW / 600 µW Will support up to 8 axes

Lifetime: >50,000 hrs, 18 month warranty

Frequency split:20 MHz ± 1600 Hz

Vacuum Wavelength Accuracy:±0.1 ppm (lifetime)

Vacuum Wavelength Stability: ±0.01 ppm (24 hrs)

Reference Signal: Fiber Optic

ZMI 2000 System Measurement Boards

# of Axes per Board: 1 (ZMI 2001, ZMI PC) / 2 (ZMI 2002)

Power Requirement:+5V ± 5% @ 3.5A (ZMI 2001, ZMI 2002, ZMI PC)+12V ± 10% @ 0.1A (ZMI PC)

Position Format: 36 bit – 2’s complement

Velocity Format: 32 bit – 2’s complement

Time Range: 107.4 seconds

Time Format:32 bit – 2’s complement

Time Resolution: 25 ns

Fiber Optic Signals: Reference and Measurement

Error Status: Reference (signal, PLL, DLL)

Measure (Missing, Dropout, Glitch)

Velocity (Board, User Defined)

Acceleration

Overflow (32 bit, 36 bit)

System Synchronization: Clock in or Clock out

ZMI VME Compliance: VMEBus specification revision C.1

6U size

A16 or A24 addressing

D16 or D32 data transfer

D08 (0) interrupt acknowledge cycle

ZMI PC Compliance:UL94V0

Full length ISA card

16 bit ISA bus

32 bit P2 bus

ABB IGCT Technology: A Revolutionary Breakthrough

Background and original intention of technology research and development

The development of power semiconductors has always been aimed at pursuing the “ideal switch”, which requires the characteristics of low pass state and commutation loss, high commutation frequency, and simple driving circuit. In the low-voltage field, the technological iteration from transistors and Darlington transistors to IGBT (Insulated Gate Bipolar Transistor) has achieved significant results. However, in the medium to high voltage field, the long-term dependence on GTO (Gate Turn Off Thyristor) poses problems such as complex control and limited performance.

To solve this dilemma, ABB Switzerland is exploring a new research and development path aimed at integrating the high-power advantages of IGBT with the core strengths of GTO, ultimately developing GCT (Gate Commutated Thyristor) and further developing it into IGCT, becoming an ideal alternative technology for GTO.

Principles and Breakthroughs of IGCT Core Technology

(1) Core improvement of GCT: solving GTO control problems

GTO has serious control issues and requires an unstable transition zone where both anode voltage and cathode current act simultaneously during shutdown, relying on buffer circuits for support. GCT breaks through this limitation through “hard drive” technology:

The rate of change of gate current reaches µ

(far exceeding GTO’s 50 A/µ s), it can switch the current from the cathode to the gate before there is a significant change in the charge distribution between the gate and anode.

Directly switch the device from thyristor mode to transistor mode, with stable and fast turn off process, no need for buffer circuit, and performance close to IGBT.

(2) The Four Key Development Steps of IGCT Converter

Low inductance drive design

To avoid the GCT entering the unstable working zone, the cathode current needs to be turned off within 1 µ s, and the leakage inductance of the gate circuit corresponding to the 3kA GCT should be ≤ 6nH (only 1/50 of the conventional value of GTO).

Low inductance is achieved through a multi-layer connection between the coaxial device connection structure and the driving power output, while using a gate voltage of -20V to balance reliability and cost-effectiveness.

Optimize silicon wafer technology

Hard drive technology allows GCT silicon wafers to be designed thinner without compromising on switch characteristics, combined with plasma engineering technology, significantly reducing losses (compared to GTO of the same specification, the commutation loss is similar but the on state loss is lower).

High integration and linear scaling of current

Integration is divided into two levels: one is single-chip integration (integrating anti parallel diodes and GCTs on the same silicon wafer to reduce diode stacking and high current connections); The second is hybrid integration (integrating GCT, driving unit, and cooler to reduce volume, improve stability, and lower costs).

Each unit of the silicon wafer (3kA devices containing over 2000 units) synchronously responds to switch instructions, achieving optimal parallel operation. The current capacity is linearly related to the silicon wafer area, making it easy to develop multi specification GCT series (such as devices with silicon wafer diameters of 38mm, 51mm, 68mm, and 91mm).

Simplify circuit complexity

No buffering capacitors, diodes, and resistors are required for GTO converters, only the current rise rate when GCT is turned on needs to be limited (as high-voltage silicon diodes are slower than low-voltage IGBT diodes).

By adopting a new high current circuit, all phases of the inverter can be connected to the same DC bus, which is comparable in cost to conventional IGBT converters.

(3) Modular design and high-voltage adaptation

Modular component system: In response to the diverse application requirements and small batch size of high-power converters, IGCT adopts modular design, which can cover a power range of 250kW to 100MW through unit series connection and adapt to different scenarios.

Pressure contact technology: Traditional module technology is difficult to handle high voltage and high current. IGCT adopts an improved pressure contact technology, which integrates the driving unit, power semiconductor, and cooler into a single functional unit. It replaces expensive chip parallel arrays with optimized silicon wafers in standard packaging, simplifies manufacturing, reduces costs, and is easy to maintain.

Performance advantages and application cases of IGCT converters

(1) Core performance advantages

Category specific advantages

Component characteristics include high rated voltage, low turn-on and commutation losses, high commutation frequency (intermittent up to 7kHz, average 500Hz for three-point converters, equivalent two-point 2kHz), high silicon wafer utilization, uniform current distribution, linear correlation between current capacity and silicon wafer area, and easy modeling

Circuit design includes a three-phase shared DC bus, a central dI/dt limiter with integrated clamping, simple intermediate circuit connection, safety and reliability under extreme working conditions, and a simple driving circuit (directly coupled with switch signals, no dV/dt or dI/dt regulation circuit required, dual line low-power power supply)

Overall performance with few and no special components, modular mechanical structure, single-chip integration even under high fixed values, high compatibility between power semiconductor control system cooler, stable and easy to center pressure contact technology, easy maintenance, efficiency exceeding 98%, high reliability (MTBF>6 years), small size and light weight, clear interface definition, support for high-power and reliable series operation, and series redundancy design to enhance reliability

(2) Typical application cases

100MW Bremen railway system interconnection device: put into operation in 1996, with 288 IGCTs running without faults, verifying the high reliability and series ease of use of IGCTs.

High dynamic application scenarios: such as uninterruptible power supply (NBPS), traction inverters, etc. Taking the ABB ACS1000 series medium voltage inverter as an example (launched in 1997 with a research and development cycle of only 2 years), it adopts a three-point IGCT inverter and a sine wave output filter, supports direct torque control (DTC), adapts to 2.3kV-4.16kV voltage and 315kW-5MW power range, and can be used for the transformation of existing non speed regulating motors. The debugging difficulty is comparable to that of low-voltage ACS600.

1.5MW air-cooled three-phase phase module: with a commutation frequency of 1050Hz, suitable for high-frequency demand scenarios.

Technological Development History and Future Prospects

(1) Development History (Key Nodes from 1993 to 2003)

1993: Hard drive GTO technology began;

In 1995, 3kA/4.5kV GCT was launched;

In 1997, 6kV/1kA reverse conducting diode (without buffer circuit) and transparent emitter technology were implemented, and the ACS1000 series inverter was launched;

Follow up: Gradually develop 4.5kV/6kA (91mm silicon wafer) GCT and 250A-4kA GCT series, achieve improvements such as integrated coolers and modular driver units, and expand application scenarios.

(2) Future prospects

IGCT technology has firmly established itself in the medium and high voltage field in just a few years, combining the advantages of GTO and IGBT to overcome their shortcomings. With excellent performance, reliability, and cost-effectiveness, IGCT will continue to expand high-power application scenarios and become one of the core technologies of medium and high voltage converters, further promoting the efficient and miniaturized development of the power electronics field.

Possible models that may be used

S-073N 3BHB009884R0021

S-093N 3BHB009885R0021 

3ASC25H705/-7

HVC-02B

5SGY35L4510

XTB750B01

751010R0815

SA811F

TP830

CI857K01

PPC902CE101

CI858K01 3BSE018135R1

PM820-1

PM820-2

PM825-1

TC820-1

SD802F

EI802F

AM801F

AM811F

UCD240A101

Search for products

Back to Top
Product has been added to your cart